|
|
|
|
|
Dumas Co-op Elevators
Patron Access
**Cash Bids**
Market Data
News
Ag Commentary
Weather
Resources
|
What Happens When a Report Day Isn't
There aren’t many upsides to the US government being shut down, most notably it’s the next big step forward to autocracy. But if looking for a golden needle in a grain pile of wheat, then I can say the fact the US government has been sucked into a black hole for what was supposed to be a USDA WASDE report day means the industry will be forced to actually pay attention to what markets are saying about supply and demand. The reality is this won’t happen. Most of the industry will spend the day like an addict going through withdrawal. Those who have to have numbers to plug into spreadsheets, regardless of if the numbers are completely imaginary, will have tears in their eyes as they stare at empty Excel cells. Some members of ag media will interview each other, asking and answering questions about how they intend to fill empty time and space without the endless stream of made-up government numbers. Meanwhile, those who actually take markets seriously will go on about their business as if today is just another day ending in ‘y’. In other news, both gold and silver took a breather from recent rallies to post modest losses pre-dawn Thursday. 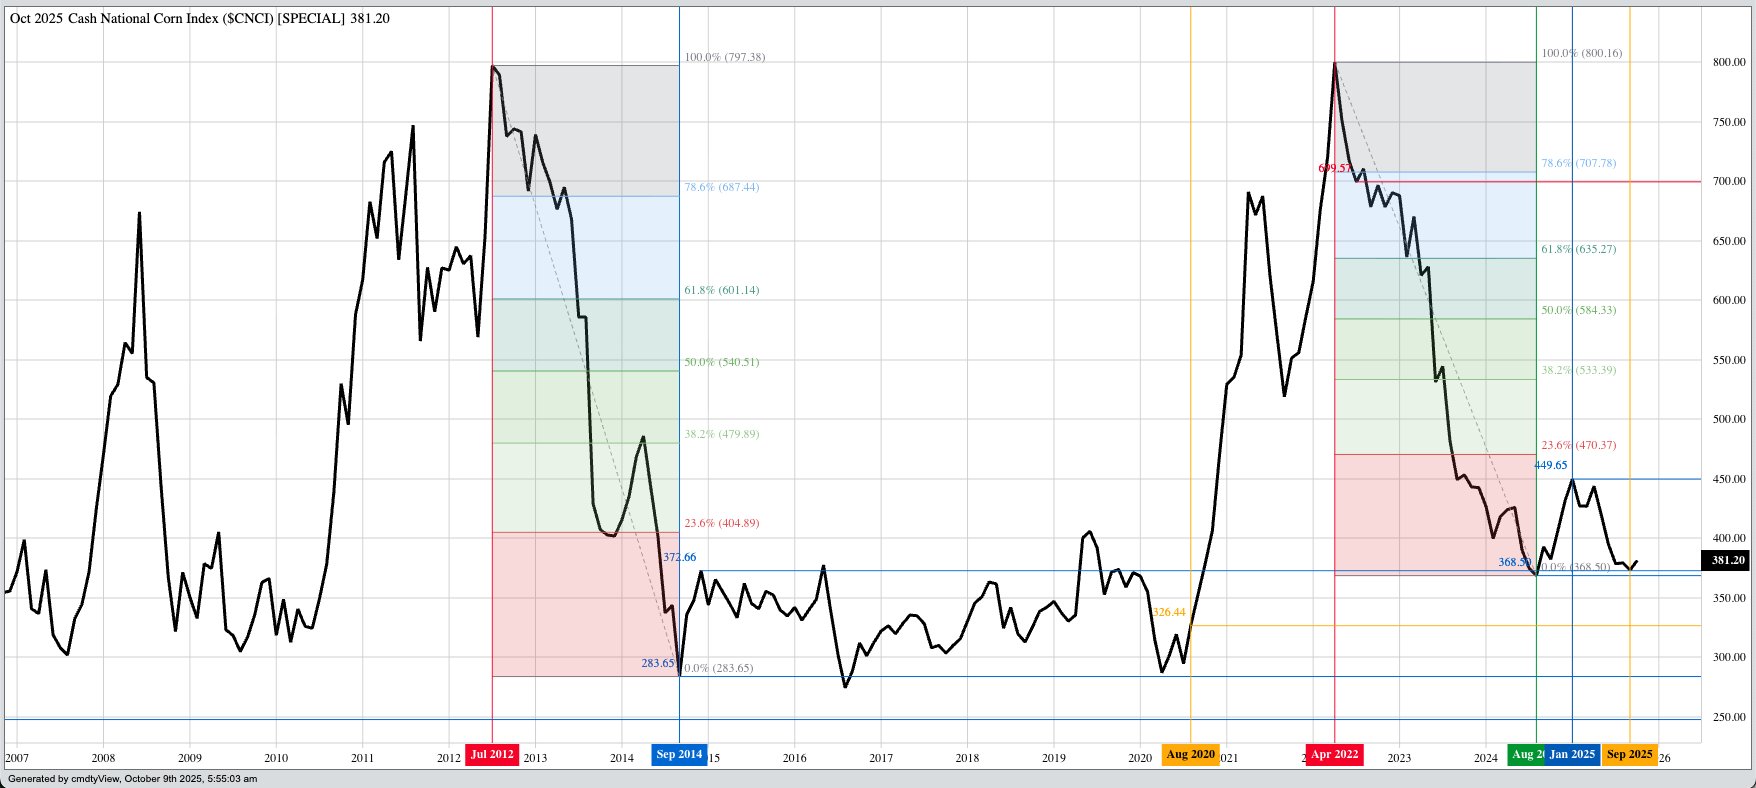 The corn market was quietly lower overnight through early Thursday morning. Yes, that is the same opening line as yesterday, but as the old saying goes, if it ain’t broke, don’t fix it. As of this writing the December issue (ZCZ25) has posted an overnight trading range of 1.75 cents on trade volume of 15,000 contracts and was sitting 0.25 cent lower. Exciting stuff, right? Given this, what do we know about corn’s real fundamentals as we head into this “report day”? The National Corn Index ($CNCI) was priced at $3.8125 Wednesday evening a price that would put the Index in the lower 20% of the price distribution range based on weekly closes only back through 2020. This tells us available supplies in relation to demand are on the large end of the range over the past 5 years. National average basis was calculated Wednesday evening at 40.75 cents under December futures, as compared to 32.25 cents under December this same week last year, which was also the previous 5-year low weekly close for this week. Therefore, we know immediate supply and demand is also more bearish. Longer-term, the Dec-July futures spread covered 41% calculated full commercial carry versus last year’s spread covering 42% this same week indicating an outlook for continued solid demand. 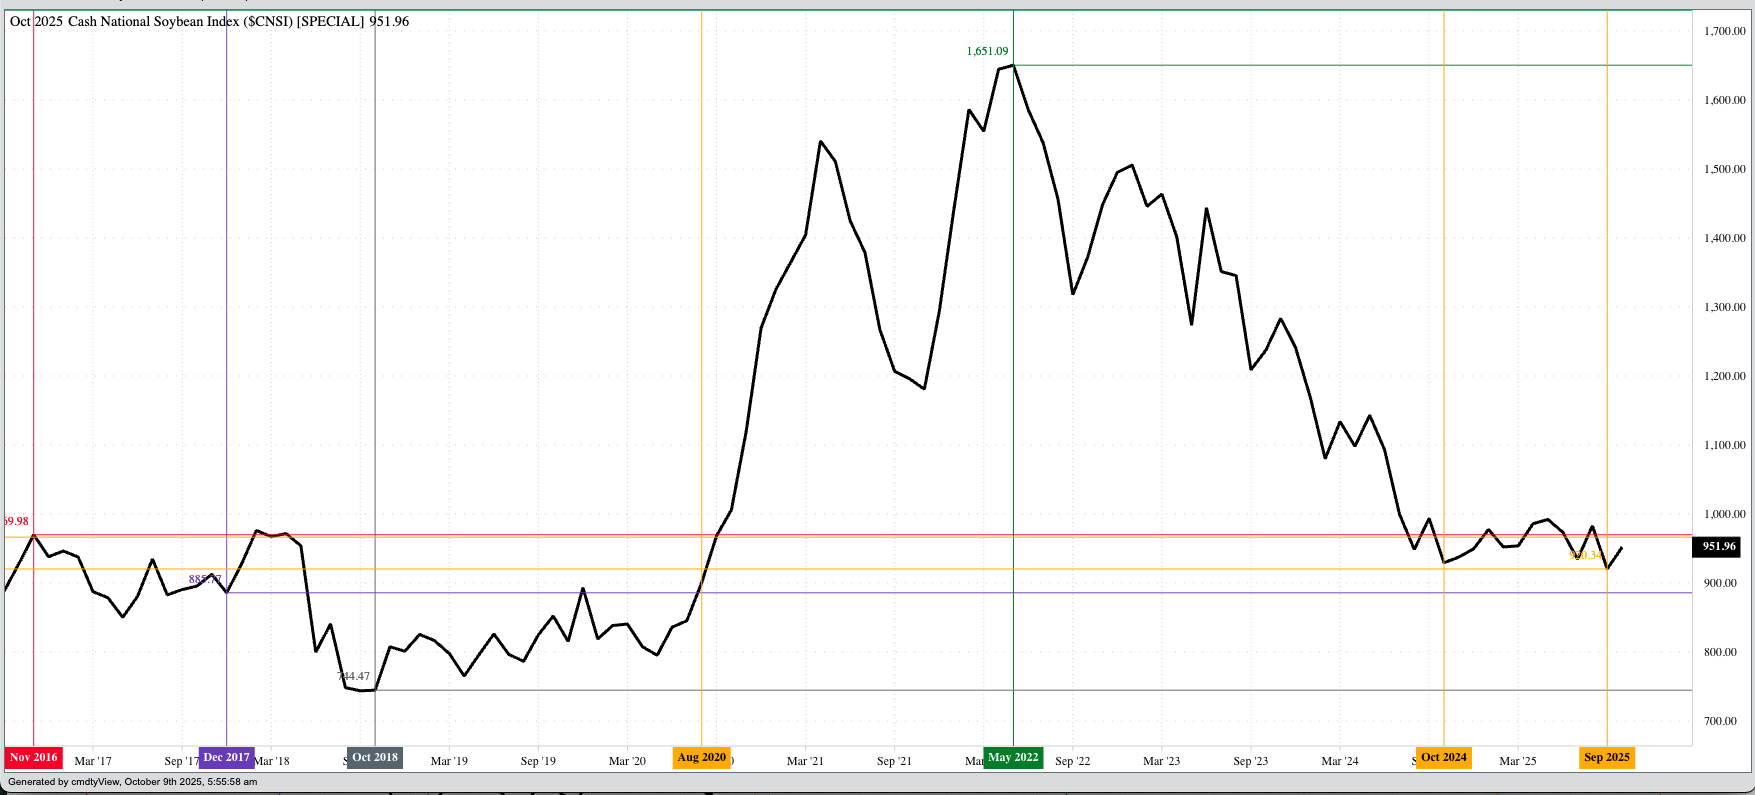 The November soybean contract (ZSX25) was down 4.0 cents pre-dawn after slipping as much as 4.5 cents overnight on trade volume of 22,500 contracts. The fact soybeans took a breather from the rally over the past week isn’t a big surprise, so we’ll see how the rest of the day plays out. Fundamentally, the market remains a long way from bullish. At the end of September, the National Soybean Index ($CNSI) was priced at $9.20, its lowest month-end price since August 2020. Based on the economic Law of Supply and Demand, this told us the US situation was as bearish as it had been in over 5 years. National average basis was calculated at 81.0 cents under November futures as compared to the end of August 2025 figure of 71.75 cents under and the previous 5-year low weekly close for the last week of September at 65.75 cents under November. Also on September 30, the Nov-July futures spread covered 55% calculated full commercial carry as compared to the 52% at the end of August and 46% the same week last year. The bottom line is US fundamentals were more bearish than a year ago, with the outlook for demand to not be great again. 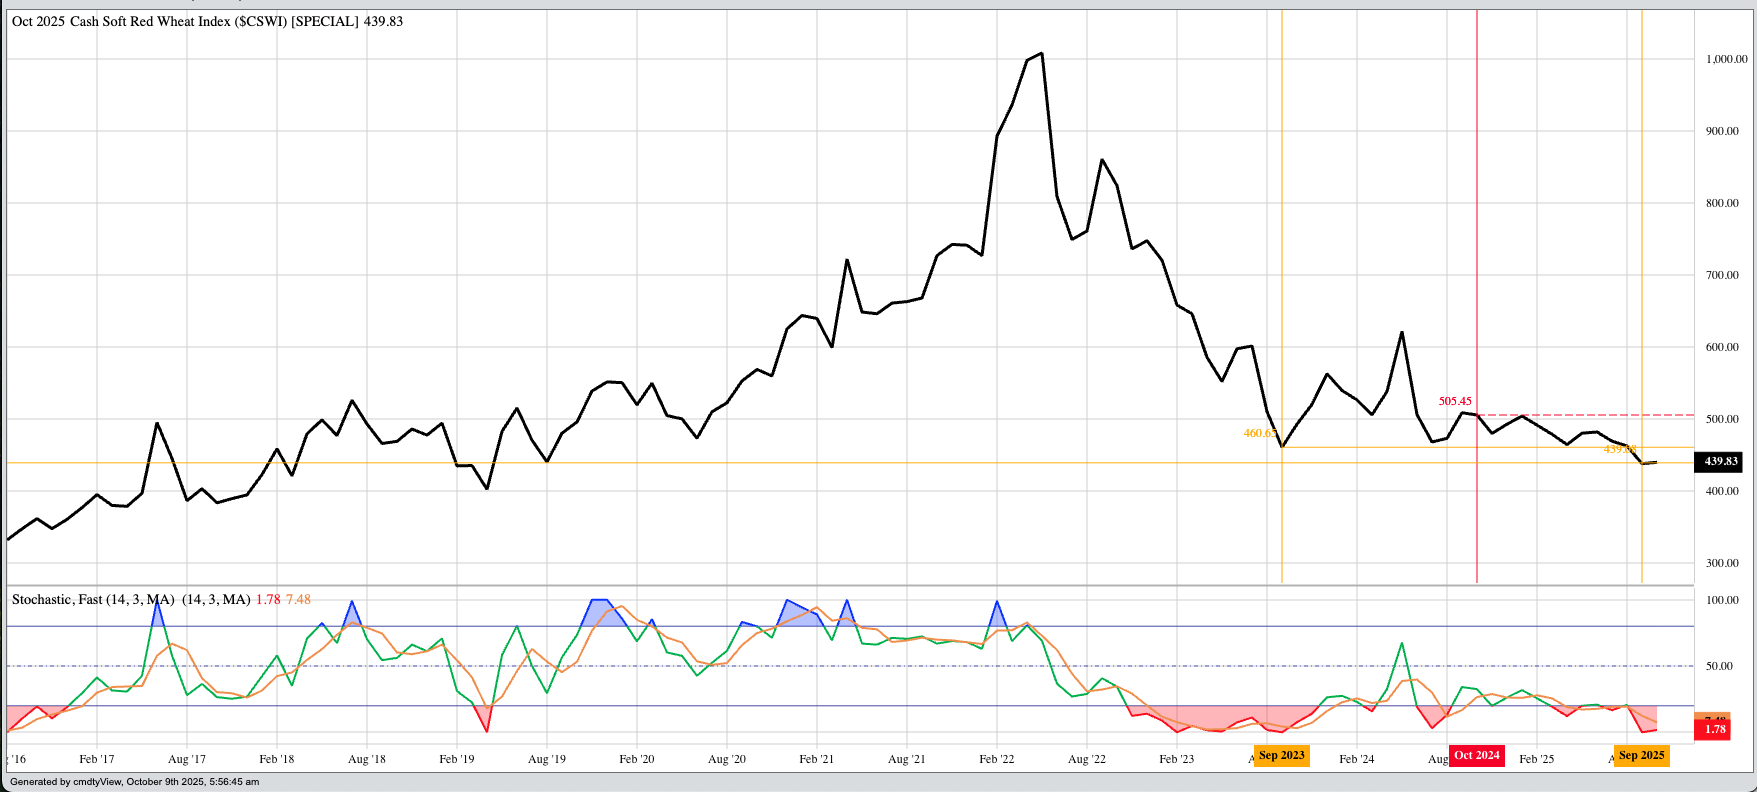 The wheat sub-sector was in the green overnight through early Thursday morning. What stands out to me is all three markets saw an uptick in trade volume with the December SRW issue (ZWZ25) registering nearly 23,000 contracts changing hands overnight. This hints at support coming from more than just noncommercial short-covering, though that activity likely continues to play a role. This week has seen National Indexes firm in relation to futures markets, across the board, indicating commercial support. Some of this is seasonal, as the bulk of newly harvested bushels are generally sold within the first 30 to 60 days of coming to town. This tends to grow supplies in relation to demand, something easily seen at the end of September. The National SRW Index ($CSWI) was priced near $4.38 as compared to its previous 5-year average end of September figure of $6.10 and 10-year average of $5.19. The HRW Index ($CRWI) came in at $4.2150 with its previous averages $6.5350 and $5.2375. The HRS Index ($CRSI) was priced at $5.0950 as compared to $7.1050 and $6.0725. The end of September 2024 saw the three Indexes priced at $5.0875, $5.2475, and $5.7225 telling us fundamentals are more bearish this time around the calendar. On the date of publication, Darin Newsom did not have (either directly or indirectly) positions in any of the securities mentioned in this article. All information and data in this article is solely for informational purposes. For more information please view the Barchart Disclosure Policy here. |
|
|
