|
|
|
|
|
Dumas Co-op Elevators
Patron Access
**Cash Bids**
Market Data
News
Ag Commentary
Weather
Resources
|
Use Seasonal Returns to Find Better Trades, from GLD to QQQ
What if the best trades of the year were already marked on the calendar? In a Barchart webinar, contributor Gavin McMaster demonstrated how traders can uncover repeating patterns in commodities and tech stocks using Barchart’s Seasonal Returns tool — and how to build trading strategies around them. “It’s not about guessing,” Gavin explained. “Seasonality helps identify recurring market behavior — and when combined with technicals or options data, it can add an extra edge.” Example 1: Gold’s Seasonal StrengthGavin started by pulling up the popular SPDR Gold Shares (GLD) exchange-traded fund (ETF). Under Technicals → Seasonal Returns, traders can view 15 years of monthly returns, showing how gold tends to perform in each month. “January consistently stands out as one of the strongest months,” Gavin noted. “That could be linked to the Chinese New Year or broader market cycles.” GLD Seasonal Takeaways:
Example 2: Nasdaq’s Seasonal PatternsNext, Gavin looked at the Invesco QQQ Trust (QQQ). The seasonality chart revealed a powerful pattern that most traders overlook. “September historically is the weakest month for QQQ,” Gavin explained. “But from November through March, tech stocks show some of the strongest returns on record.” This “winter tech rally” has appeared consistently over the last 15 years — often aligning with holiday sales, fiscal spending cycles, and earnings optimism. 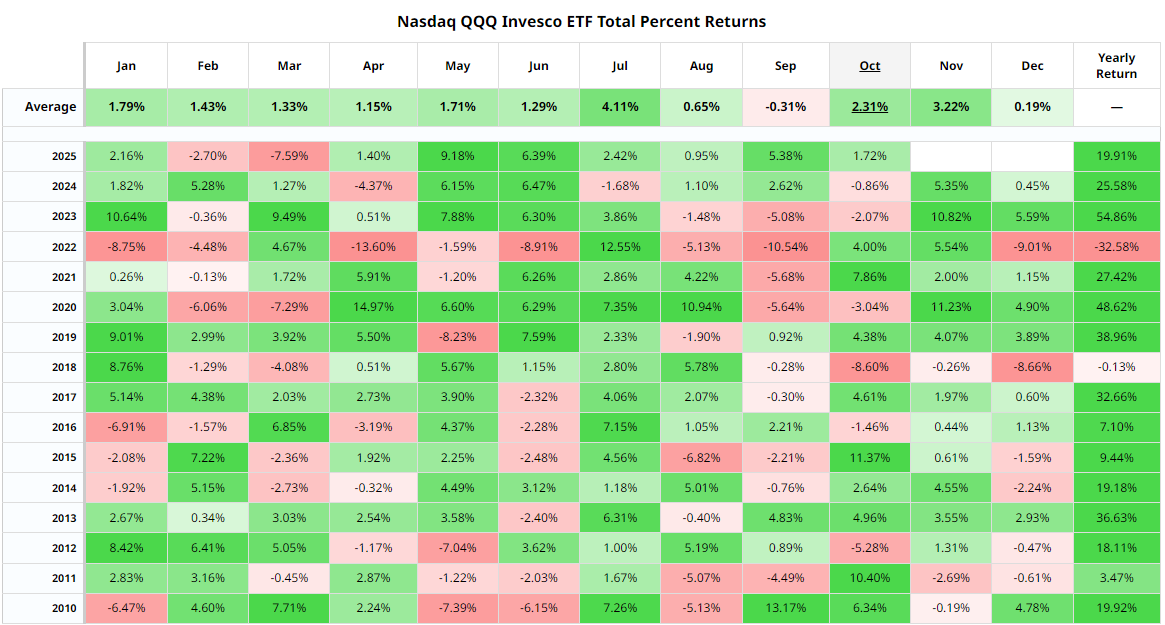
QQQ Seasonal Takeaways:
How to Trade Seasonality (According to Gavin)Once you’ve identified the patterns, the next step is execution. Gavin outlined three approaches for traders to capitalize on seasonal data:
Examples:
“You’re putting probability on your side,” Gavin said. “You can’t predict the market, but you can trade in alignment with what history shows tends to happen.” Tools to Try on BarchartUse these Barchart features to start building your own seasonality-based strategy:
The Bottom LineSeasonal data doesn’t guarantee profits, but it gives you context. By knowing when assets tend to outperform or struggle, you can stack the odds in your favor and refine your entry timing. “Seasonality won’t replace your strategy,” as Gavin said. “But it can strengthen it — like trading with the wind at your back.” Watch the clip for a quick breakdown →
On the date of publication, Barchart Insights did not have (either directly or indirectly) positions in any of the securities mentioned in this article. All information and data in this article is solely for informational purposes. For more information please view the Barchart Disclosure Policy here. |
|
|
