|
|
|
|
|
Dumas Co-op Elevators
Patron Access
**Cash Bids**
Market Data
News
Ag Commentary
Weather
Resources
|
The Saturday Spread: Use Distributional Bifurcation to Roadmap Your Options Trades
When conditions turn pitch black, pilots are trained to trust their instrument panels, not their instincts. That’s because under inclement conditions where visibility is severely compromised, spatial disorientation — a condition where the inner ear and body sense motion or orientation incorrectly — can easily occur. Unfortunately, similar situations often materialize in the equities market. It’s remarkable that when people trade stocks and especially options, they’re typically depending on fly-by-the-seat-of-their-pants tactics and reactions. Very few, if any, traders are aware of the baseline probabilistic distribution of their target security and how it contrasts against their projected distribution. That would be like a baseball manager picking their lineup without having any awareness of individual players’ batting averages and how they each stack up against the competition. Obviously, such malpractice doesn’t exist in professional sports. However, it happens all the time in finance — and that’s a dynamic that needs to change. One clear solution is to use a methodology called distributional bifurcation. Essentially, each stock has a baseline personality, with an average exceedance ratio (frequency of upside relative to the starting point) and magnitude of reward. However, the equities market encounters sentiment regime shifts that can alter the expected probabilistic distribution curve. By comparing the two curves, we can pinpoint where favorable asymmetries lie — and with data curated from Barchart Premier, extract mathematically sensible ideas. Long story short, we let the data guide our decision-making process, not emotions or other exogenous noise. Kimberly-Clark (KMB)To really make sense of distributional bifurcation, it helps to convey price action not as continuous scalar signals but rather as discrete states. Personally, I prefer using a quasi-binary sequential logic, defining everything under the context of up and down weeks. In this manner, we can track behavioral states rather than constantly flashing tickers. 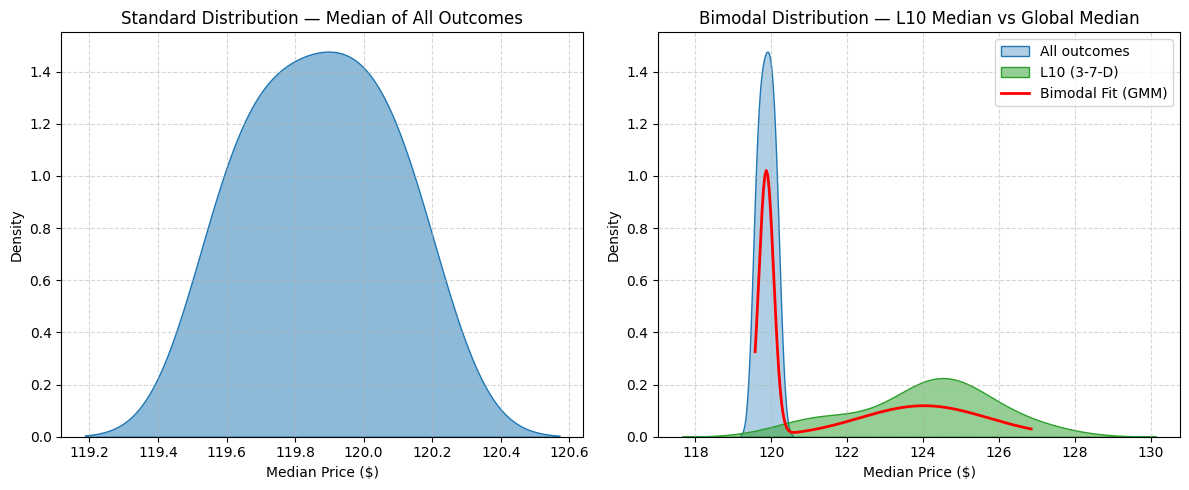 Under this new framework, Kimberly-Clark (KMB) stock has printed a 3-7-D sequence in the last 10 weeks: three up weeks, seven down weeks, with an overall downward trajectory. Since January 2019, this sequence has flashed 19 times, meaning that it represents only 5.69% of all identifiable patterns. However, what’s distinct about this sequence is that it tends to witness buy-the-dip sentiments. Under baseline conditions, the “center of gravity” for KMB stock is around $119.90. However, when the sentiment regime shifts to 3-7-D mode, the risk-reward curve flattens, with the center of gravity sitting around $125. True, the spread of possible price outcomes over the next 10 weeks widens considerably, which technically means KMB stock becomes more unpredictable. However, this expanded range generally extends above the price distribution of baseline conditions. 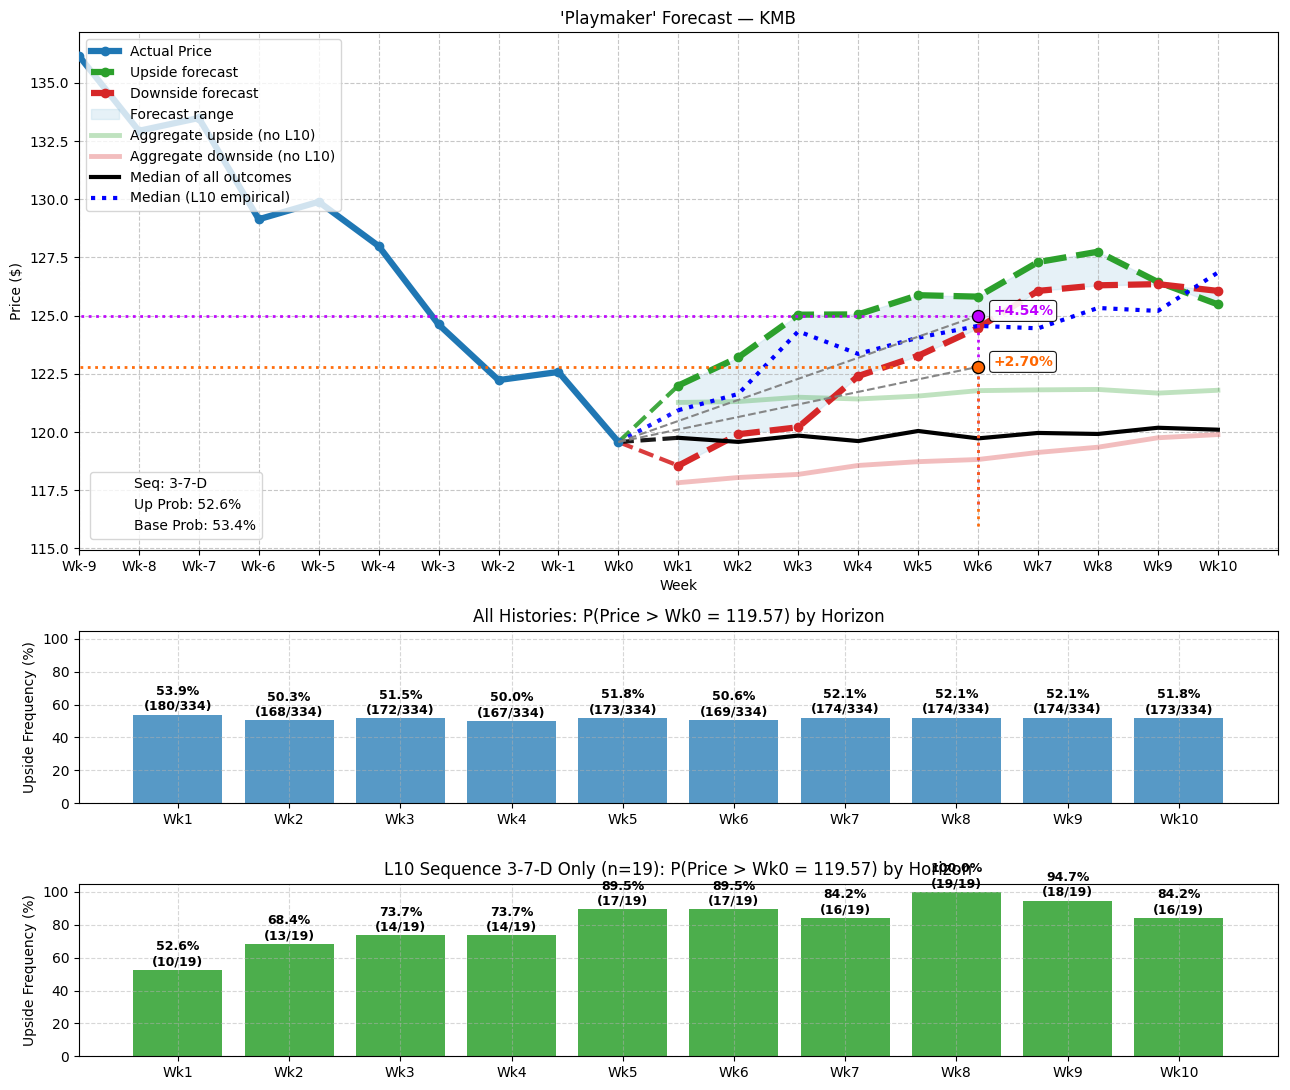 In musical terms, KMB stock encounters a key change one whole note higher. Those who are interested in speculating on the security may consider the 120/125 bull call spread expiring Nov. 21. Procter & Gamble (PG)Using the same framework mentioned above, Procter & Gamble (PG) stock has printed a 4-6-D sequence in the past 10 weeks: four up weeks, six down weeks, with an overall downward trajectory. This sequence is a bit more common, having materialized 36 times, representing roughly 11% of all identifiable behavioral states in the dataset. 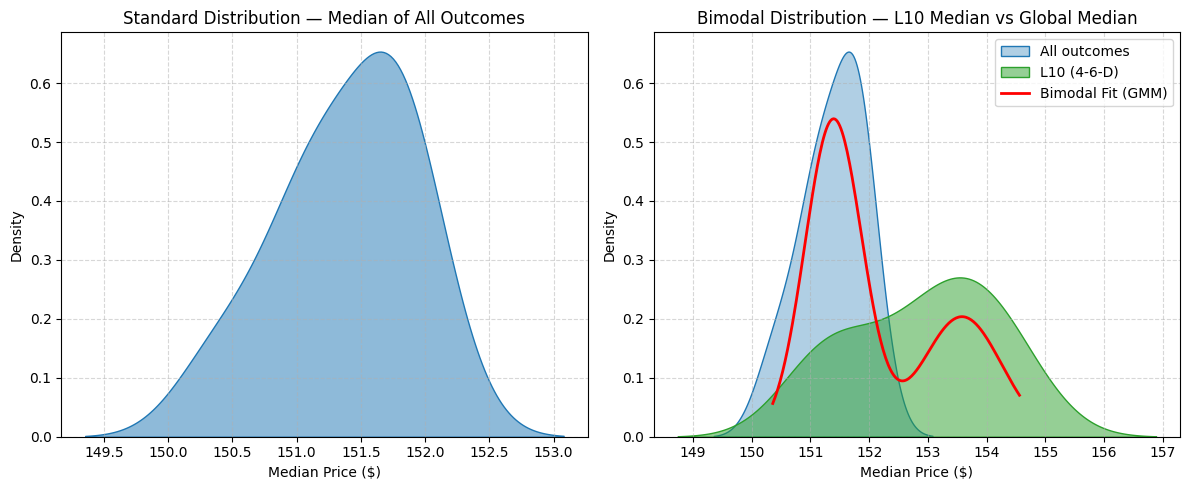 Using past analogs, the exceedance ratio relative to the anchor price is at least above 61% across each of the next 10 weeks. What’s more, the median price of outcomes tied to the 4-6-D sequence tends to be conspicuously higher on average relative to the median price of all outcomes. In colloquial terms, traders tend to buy the dips in PG stock. Under baseline conditions, PG’s center of gravity is around $151.50, with the meat of expected prices typically landing between $150.50 and $152. However, under 4-6-D conditions, the distribution curve flattens, with the center of gravity landing between $153 and $154. Moreover, the bulk of projected activity occurs between $151 and $155. 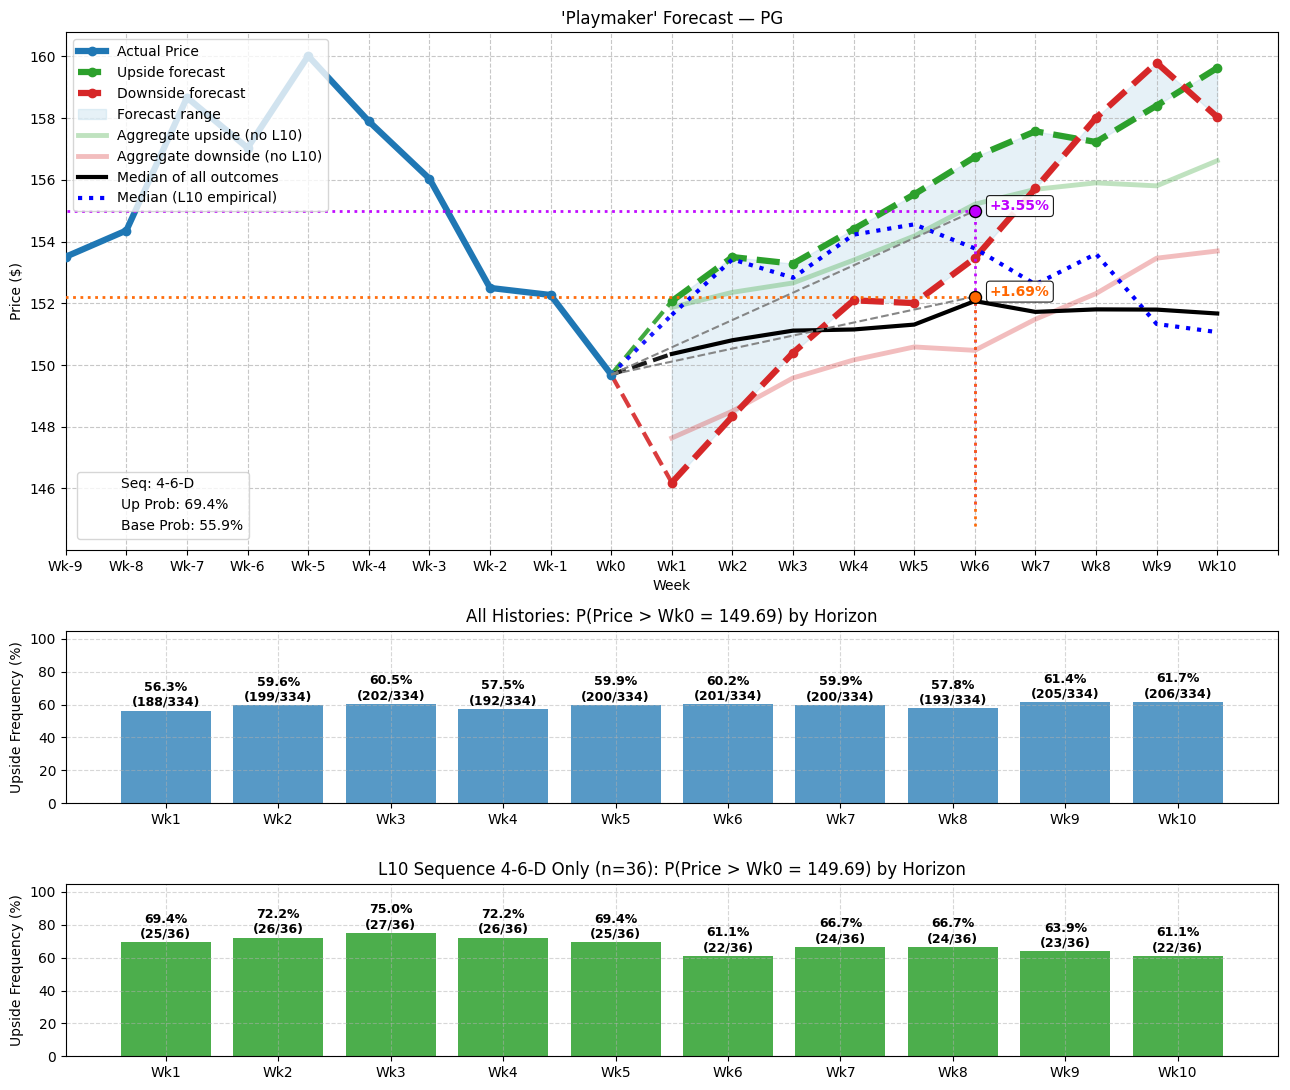 As with Kimberly-Clark, PG stock may encounter a wider spread of pricing possibilities but at a higher baseline — again, as if a positive key change were to occur. Those interested in speculating may consider the 150/155 bull spread expiring Nov. 21. Super Micro Computer (SMCI)Last but not least, Super Micro Computer (SMCI) has printed an unusual 6-4-D sequence: six up weeks and four down weeks, yet with an overall negative trajectory. It’s a rare sequence, having only materialized 20 times since January 2019. As such, the 6-4-D represents only 6% of all identifiable behavioral states. 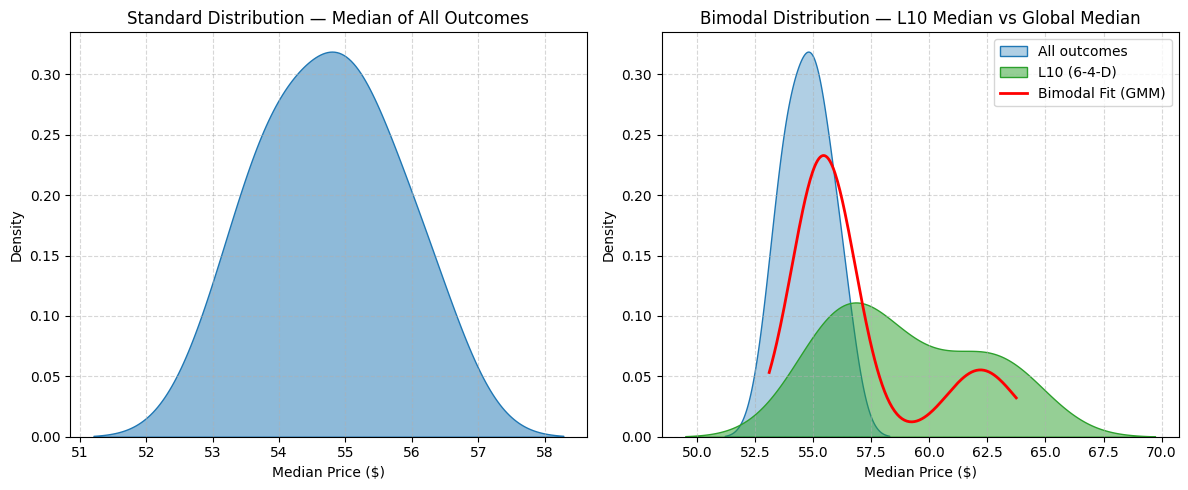 However, from past analogs, the exceedance ratio across the next 10 weeks is high, ranging from 65% to 75%. Further, the median price of outcomes tied to the 6-4-D stands noticeably above the median price of all outcomes. Under baseline conditions, the center of gravity for SMCI stock is roughly $54.50, with the bulk of activity occurring between $53 and $56. However, under the 6-4-D, the distribution curve flattens considerably, with the center of gravity landing at around $58. Plus, the majority of trades occur between $54 and $64. 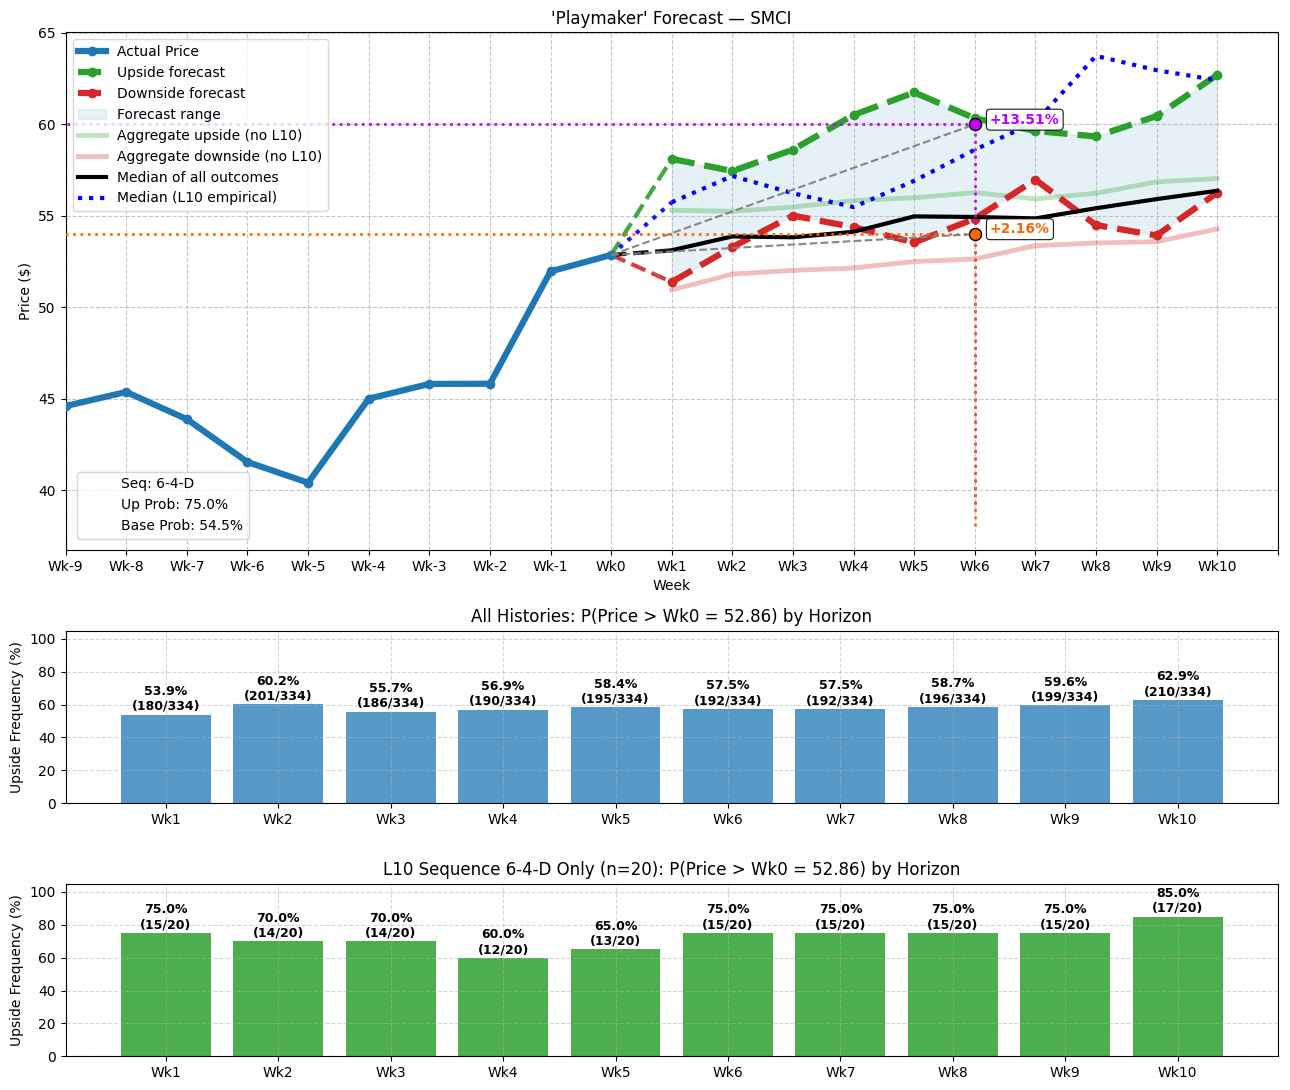 Given the unusual distribution of SMCI stock, it’s liable to incur an opportunity cost. Still, for those who are intrigued about taking a bet, the 50/60 bull spread expiring Nov. 21 is worth a look. On the date of publication, Josh Enomoto did not have (either directly or indirectly) positions in any of the securities mentioned in this article. All information and data in this article is solely for informational purposes. For more information please view the Barchart Disclosure Policy here. |
|
|
